
By Matthew Redekopp
Analytics is a powerful problem-solving tool that can help school maintenance staff quickly analyze and identify routine problems that affect comfort and energy use.
And many facilities managers have never even heard of analytics.
What is analytics
At the most basic, analytics is the application of engineering principles and building automation data to solve real-world problems. Automated software platforms often include analytics as a service, but analytics can be completed as an ad hoc process using spreadsheets or other free tools.
No matter how analytics is performed in your facilities, the benefits are tangible. Through the ongoing analysis of a facility’s systems, problems can be identified to improve comfort, save energy and save time for all maintenance workers.
Getting started with analytics in your schools
It is important to understand that analytics does not replace willing participants in the maintenance process and depends upon a good relationship with your controls contractor, maintenance staff and usually a competent consultant. Competency doesn’t just mean engineering smarts; it means effective communication will all your staff.
From there, analytics is a relatively straight forward process: collect data and analyze it. The key is to analyze the data in context of your facilities, systems and any problems or complaints from occupants.
How analytics benefits K-12 schools
A real-life case study
Let’s look at a simple application of analytics to explore the advantages.
Consider the seasonal cold weather temperature complaint. You have a school that underwent a modernization five years ago and you’ve always suspected that the boiler was undersized by design. A good number of classrooms are regularly uncomfortably cold and you just can’t seem to get enough heat out of the boiler into the rooms. There is a constant-volume air handling system with a fan in the mezzanine and reheat coils in the classroom. The temperature complaint comes in the morning after a cold snap but you can’t get down to your tools until a couple days later when things are warmer.
Right off the bat, you cannot recreate the outside temperature conditions but you do have a couple of days of trend logs (which are sometimes helpful and sometimes not) and the instantaneous sensor conditions at the moment. How you proceed in your troubleshooting will depend on how well you know the system and how much time you’ve got.
What can analytics do for this building?
As analytics is the use of multi-day data with engineering principles, one of the things we can do is see how two or more variables interact overtime. For example, we can look at how the outdoor air damper position varies with outside air temperature. Or how boiler supply water temperature varies with outdoor air temperature.
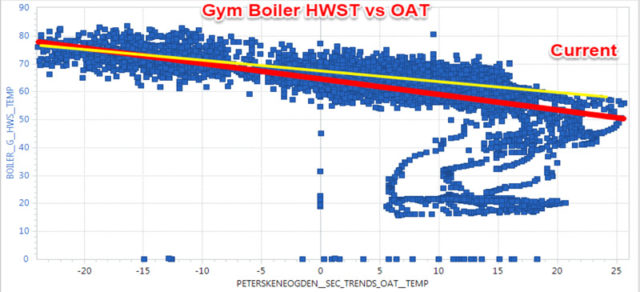
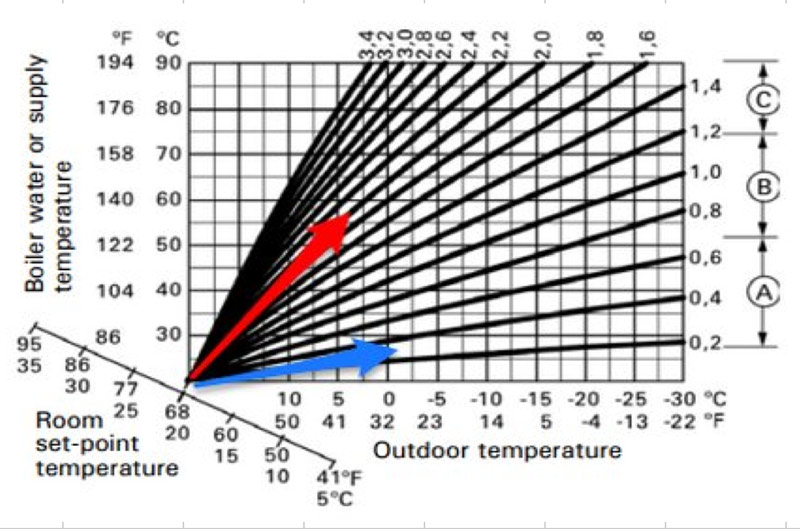 One of the relationships that is worth looking at is condensing boiler supply water supply (SWT) reset as a function of outdoor air temperature (OAT). This is the chart that resulted from this analysis.
What we see is a line that starts high on the Y-axis and low on the x-axis (representing high water temperature and low OAT) and decreases from left to right indicating that SWT drops as the OAT rises. Condensing boilers require a return water temperature (RWT) of 55°C or lower. In this chart, the circle area reveals that when OAT is in the heating region the return water temperature never reaches 55°C. This impact on the boiler is like that of a turbo charged engine at a race: if the motor never receives the extra power from the turbo charger (which is like the condensing contribution from the condensing boiler), then it is only getting a fraction of its overall horsepower. That car is not going to set any new records. This boiler plant is likely to be accused of being undersized.
Another relationship to look at that was particular to this school, was how a bypass valve installed on the boiler side of a heat exchanger was interacting with the system. The bypass allowed water to recirculate back to the boiler when thebuilding was calling for less heat.
Looking at this graphic, we see that the building automation system says that the valve is open 85% and allows 15% bypass. Testing the heat output from the heat exchanger as a relationship to valve position resulted in the following scatter chart. Notice that as the valve opens, the heat output diminishes. Some manual testing of the valve in the boiler room confirmed that the valve position was reversed in the BAS so that is the temperature outside dropped in the control system asked for more hot water from the boiler the valve was throttling off delivery. That is part two in the solution to the temperature complaint.
The third relationship to look at is how the BAS outside air damper (OAD) position relates to the trended return air temperature (RAT) and mixed air temperature (MAT). Using the engineering principle of conservation of mass, we can calculate the OAD position as a function of MAT and RAT and then compare it against the trended OAD. On this chart, we see the calculated OAD vs the actual OAD where the Y axes represents actual and the X axis the calculated. What we get from this analytics is confirmation that the actual outdoor air being supplies is much higher and volume and with the BAS thinks it is. The result is that the system is getting flooded with cold outside here and us overwhelming the primary heating coils before it reaches the rooms.
Bringing all three relationships together we get a good picture of why we have systematic temperature complaints and a general belief in an undersized plant. When it is cold outside, the OAD opens up more than it should and floods the AHU with more cold air than the coils can keep up with. The coils and the terminal reheat, for their part, cannot keep up with the heating on two accounts: the bypass is only allowing 15% of the hot water to reach the heat exchanger and the boiler is missing 25% of its capacity because it is not condensing. These problems stem from the sequence of operation and set points given to the system and not to the hardware itself.
These conclusions about the system were reached in only a few hours and allowed the district to make changes before the warranty for the building was over.
Analysis requires data and often the building automation system is not configured or is incapable of trending. We will explore how to solve this problem in the next article in this series.